

🧭 The Offramp Politics Crime Index
The Race Data Audit

There is a persistent belief in American discourse that crime statistics are transparently racialized across the board.
That is not true.
Race data is highly visible in some crime categories.
It is fragmented, filtered, or entirely absent in others.
So instead of speculating, I pulled what is actually measurable — federal sentencing data and arrest-level data — and laid it side by side.
This is not a measure of who “commits crime.”
It is a measure of who is processed by the system.
That distinction matters.
⚙️ What This Data Is
Most of the data below comes from the U.S. Sentencing Commission (FY2024).
That means:
These are racial breakdowns of individuals sentenced in federal court for specific offense categories.
Not all offenders.
Not all incidents.
Not civil settlements.
Not uncharged misconduct.
Just federally sentenced defendants.
One category — DUI — comes from FBI arrest data.
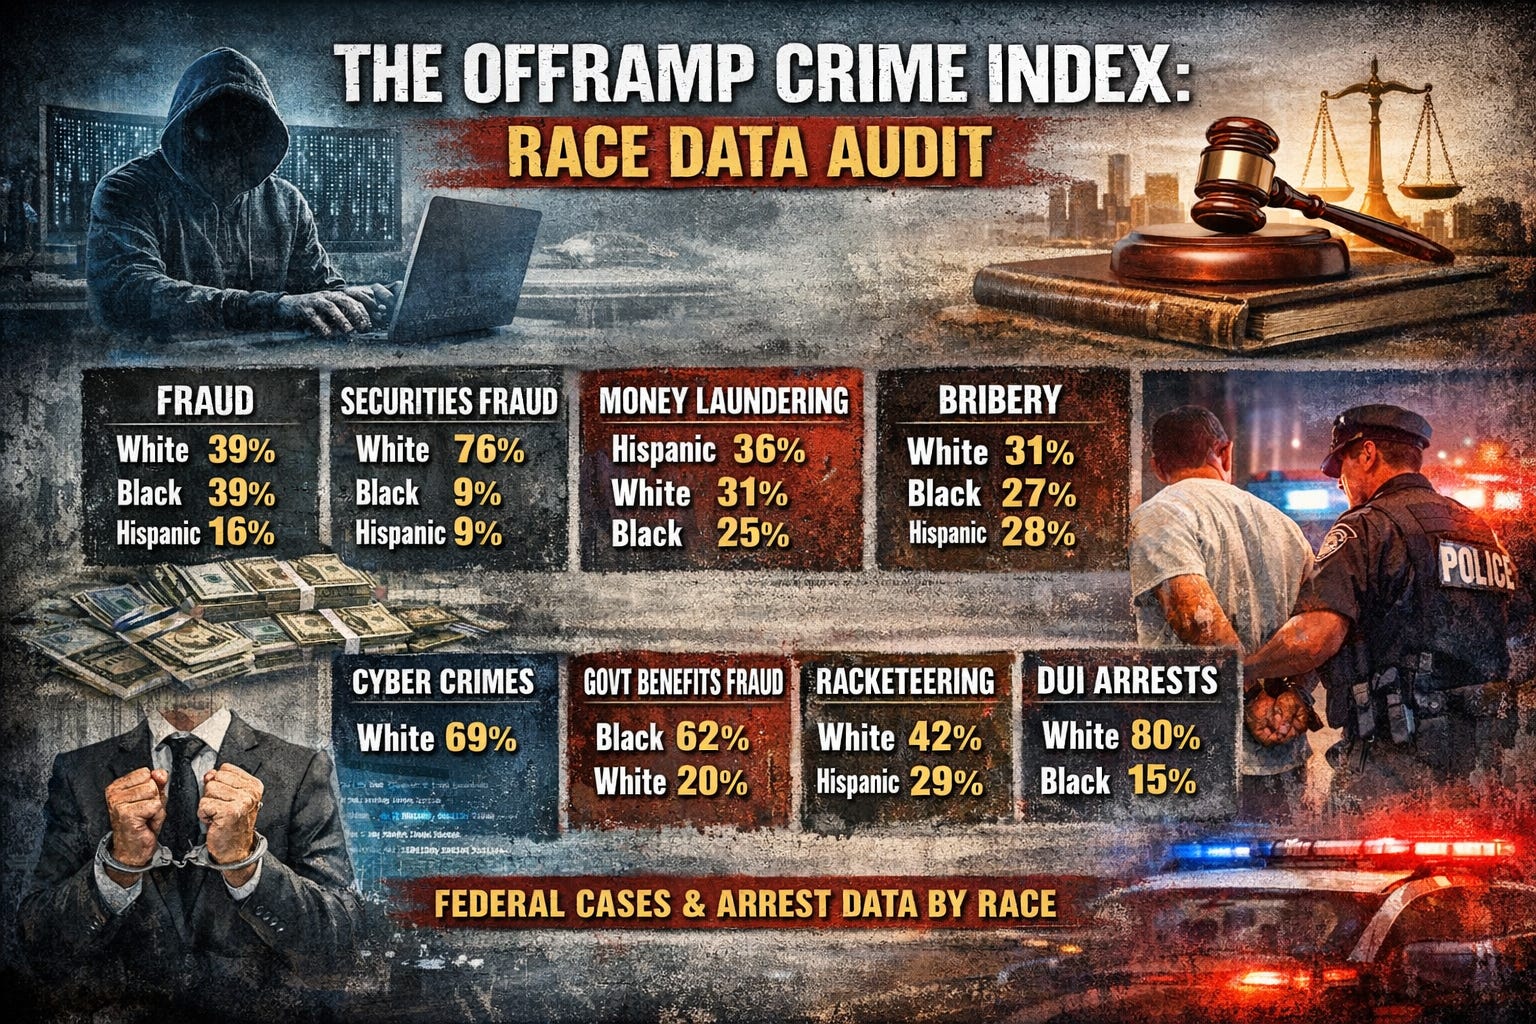
📊 Federal White-Collar & Structural Crime (FY2024)
1. Fraud (Theft / Property / Fraud Combined)
White: 38.6%
Black: 38.6%
Hispanic: 16.0%
Other: 6.8%
2. Securities & Investment Fraud
White: 76.2%
Black: 8.5%
Hispanic: 8.5%
Other: 6.8%
3. Money Laundering
Hispanic: 35.9%
White: 31.1%
Black: 24.8%
Other: 8.2%
4. Bribery (Public Corruption)
White: 31.4%
Hispanic: 27.8%
Black: 26.9%
Other: 13.9%
5. Tax Fraud
White: 51.5%
Black: 25.9%
Hispanic: 11.3%
Other: 11.3%
6. Cyber Technology-Related Federal Cases (2014–2021 study)
White: 68.6%
Other categories combined: 31.4%
(This category measures federal cases involving hacking, cryptocurrency, dark web activity, etc.)
7. Stalking / Harassing (Federal)
White: 56.9%
Black: 20.6%
Hispanic: 9.9%
Other: 12.6%
8. Extortion / Racketeering (Organized Crime Proxy)
White: 42.2%
Black: 20.2%
Hispanic: 29.4%
Other: 8.3%
9. Government Benefits Fraud
Black: 62.4%
White: 19.7%
Hispanic: 14.1%
Other: 3.8%
🚗 10. DUI Arrests (FBI UCR, 2019)
White: 80.1%
Black: 14.9%
American Indian / Alaska Native: 2.4%
Asian: 1.9%
Native Hawaiian / Pacific Islander: 0.7%
🔎 What This Actually Shows
First, race data absolutely exists in federal structural crime categories.
Second, the racial distributions vary significantly by offense type.
Third, “white collar crime” is not demographically uniform.
Fourth, what the public often assumes about crime categories rarely matches the federal sentencing breakdowns.
But here is the most important point:
This is prosecution-level data.
Not incidence data.
These numbers reflect:
Who was charged
Who was prosecuted
Who was sentenced
In federal court
They do not reflect:
All crimes committed
Civil settlements
Corporate entities fined
International actors not prosecuted domestically
Crimes that never resulted in charges
🧠 The Structural Insight
Race is highly visible in arrest-based street crime.
Race is also measurable in federal white-collar sentencing.
But what is not measurable is:
The racial distribution of uncharged structural harm
The racial distribution of corporate entity misconduct
The racial distribution of settlement-based enforcement
The racial distribution of anonymous cyber actors
So the asymmetry is not absolute absence.
It is enforcement filtration.
And enforcement filtration shapes narrative filtration.
🛰 Why This Matters
If public discourse focuses heavily on categories with high demographic granularity — while largely ignoring categories resolved civilly or corporately — then perception of “who commits crime” becomes skewed toward visible enforcement categories.
That is not conspiracy.
That is data architecture.
The Offramp Crime Index was built to measure systemic harm.
This race audit simply shows where the data is clear, where it is filtered, and where it is structurally opaque.
No moral panic.
No accusation.
Just measurement.
Because measurement changes the conversation.
And conversation shapes the system.